Loading...
     
Research-Focused

Assisted Self-Triage: Evaluating Health & Taking Action

A research study to understand how a technology might help people more accurately identify, self-monitor, and resolve their health symptoms.

My Role UX Researcher
Collaborators Two DePaul University students
Categories Digital Health, Telemedicine, Medical Triage
Duration 8 weeks
Tools Qualtrics, Atlas.ti, SPSS Statistics, Lucidchart
Avatar
heart pulse

1. Understand

Opportunity

Studies have shown that overcrowded emergency departments compromise care and result in higher mortality levels. Unnecessary emergency room visits contribute to overcrowding. In 2017 the US Centers for Disease Control and Prevention reported that 55 of the 139 million emergency room visits were non-urgent (Caldwell et al., 2013). Symptom checkers may offer a more personalized health assessment than online searches alone, and could be useful for self-triage when deciding what kind of medical care is needed when symptoms of illness arise (Aboueid S et al., 2021).

Challenge

When experiencing adverse health symptoms, consumers are faced with the task of making time-sensitive decisions often with limited knowledge about their condition. They seek answers online, but often find ambiguous and contradictory information dispersed across multiple sources. Consumers can face undue anxiety and inaccurate self-diagnosis due to the high volume of low quality and unverified sources; or find generalized information containing advertisements that are easily confused with medical advice. At the time of this study, many online symptom checkers only displayed potential medical conditions and did not take into account personal health data or demographics. Many online health chart applications do not provide a symptom checker or advice on when to contact a provider. Our team wondered if there was a way to make the decision process easier?

How might we...

The motivation for our project was to enable consumers to take charge of their health and feel confident when confronted with emerging health symptoms. We asked, “How can a technology-based product help people make informed decisions about choosing when to visit medical providers, urgent care clinics, and emergency rooms?”

2. Empathize

Methods for this phase

Method 1: Observations

This section details our observation participants, data collection procedure, and data analysis methods.

Participants

We recruited ten participants (four male, six female) through snowball sampling from our connections and the DePaul University College of Digital Media (CDM) Participant Pool. All provided verbal informed consent before the study. One of the ten participants was in-person. All participants had access to a webcam.

Participant Pseudonym Age Gender Identity
Lisa 54 Female
Jeevan 47 Male
Roland 25 Male
Louise 26 Female
Linda 24 Female
Bob 25 Male
Ann 25 Female
Carla 30 Female
Valerie 48 Female
Timothy 55 Male

Data Collection Methods

We began observations with an introduction followed by preliminary questions about their emotions and perceptions of their healthcare experiences. Next, we asked participants to solve scenario-based problems related to health. The first scenario was about if the person received a bad sunburn on vacation resulting in a new mole. The second was about the person having stomach pain around the belly button after eating a large dinner.

View Observation Protocol

Next, we asked follow-up questions about how they solved the scenario problems. We also asked about their technology use to monitor their health. We concluded our session with demographics questions.

Health Tools used by Participants

Data Analysis Methods

Using the AEIOU framework, we created an Affinity Diagram to group common user behaviors and responses into themes and created a diagram to visualize a typical user task flow. AEIOU is a research and observation framework created by the Doblin Group. It is useful for organizing and coding observation notes for Affinity Diagrams and Task Flows.

AEIOU is an acronym which stands for the following:

  • A is for Activities which are actions performed by a user to accomplish a goal. Activities are comprised of interactions.
  • E is for Environment which represents the physical world in which the activities take place.
  • I is for Interactions which are the components or building blocks of activities.
  • O is for Objects which the users interacts with.
  • U is for Users which are the individuals who perform activities in an environment through interactions with objects and other users. Their behaviors and needs are observed.

Affinity Diagram - Observations

Affinity Diagram

We created categories based on user observations and learned how participants gather health information, devise courses of action, and what pain points they experience in managing their health.

Affinity Diagram

Self-Triage Task Flow

Task Flow Model

We created a task flow model to represent how participants perform self-triage as they attempt to resolve an illness or injury.

Task Flow

Method 2: Interviews

This section details our interview participants, data collection procedure, and data analysis methods.

Participants

We recruited seven participants (one male, six females) through snowball sampling from our connections and the DePaul University College of Digital Media (CDM) Participant Pool. One participant was in-person, and six participants were over Zoom. All read an informed consent before the study.

Participant Pseudonym Age Gender Identity
Lisa 54 Female
Kevin 66 Male
Arie 87 Female
Janelle 29 Female
Gina 27 Female
Jill 23 Female
Katie 25 Female

Data Collection Methods

We conducted the interviews separately and introduced the project. The participants provided a verbal consent. We asked the participants warm-up questions about what they do when they are not feeling well. Next, we asked the participants questions about their experience at the doctor’s office, in the emergency room and with health tools. We audio-recorded and transcribed the interviews.

View Interview Protocol

Data Analysis Methods

We then devised codes individually for each participant using Atlas.ti employing a ground-up approach called "inductive coding" where we dervied our codes from the data. We then created an affinity diagram based on our codes and identified several spectrums that represented our participants’ characteristics and behaviors. Finally, we created personas based on participant groupings along each spectrum.

We identified the following spectrums:
  • Tech-Savvy (low – high)
  • Level of Treatment (self-treat – go to ER)
  • Symptom Monitoring (less likely – more likely)
  • Symptom Severity Level (low – high)
  • Trust of Online Health Information (low – high)
  • Telehealth Knowledge (low – high)

Affinity Diagram - Interviews

Affinity Diagram Part I

We created categories based on user interviews and learned how participants assess the onset of symptoms, how they research their conditions, which communication tools they, emotions felt, courses of action taken, trust in online information, and suggested features for a self-triage technology.

Affinity Diagram

Affinity Diagram Part II

Affinity Diagram

Personas

To help us understand the goals and frustrations of our users when making healthcare decisions, we created two personas depicting those who would interact with a self-triage based technology, which we named, "MedAssist." Personas were developed from our spectrums and survey hypothesis.

Busy Brianna
  • More likely to self-treat
  • Avoids seeing a doctor
  • Researches health information before treatment
  • Researches symptoms and home remedies

I think I did try to Google it that time, what can I do to alleviate the pain, or what are the consequences if I wait too long?

Behavior:
If she can’t resolve a persistent symptom on her own, she’ll go see a specialist
Goals:
Seeking reassurance to feel confident in health care decisions
Frustrations:
Finding similar symptoms for multiple conditions when searching online

Sandeep the Seeker
  • More likely to go to a doctor or ER
  • Researches Health Information after treatment
  • Researches conditions, diagnoses and medications
  • Learns what others do to treat same condition

MayoClinic, WebMD, I think those are the two that stick to my mind where I’m trying to educate myself either about a symptom or a prescription that I’m taking for side effects or what they’re supposed to do.

Behavior:
Goes on online to learn more about a chronic condition to fill in the gaps from doctor visit
Goals:
Getting the best health advice, even if it means getting second opinions
Frustrations:
Not getting a clear follow-up with the doctor after check-ups

Method 3: Survey

This section details our survey participants, data collection procedure, and data analysis methods.

Participants

We recruited participants through the DePaul University College of Digital Media (CDM) Participant Pool, and our social networks. To participate in the study, respondents had to be at least 18 years old. A total of 33 respondents (11 male, 22 female) were recorded. Participants ranged in age from 18 to 75 years old.

Data Collection Methods

We used Qualtrics to develop the survey. The survey was available for five days and was organized into four parts.

Part 1 – Warm-Up:
We asked participants questions about their experiences with the doctors and ER.
Part 2 – ER and Medical Providers:
We asked questions related to their decisions about going to the doctor and ER.
Part 3 – Online Tool Information:
We asked questions about their experiences and views on online tools.
Part 4 – Demographics:
We asked questions about their age range, gender, health status, and location of primary residence.

View Survey Protocol

Data Analysis Methods

We exported the Qualtrics survey data to SPSS for analysis. We used the Qualtrics Report feature to support analysis. We also used Atlas.ti to code open-ended responses.

We hypothesized that age (five categories) was associated with self-treatment of symptoms for fourteen conditions. We tested this hypothesis using a Chi-Square test in SPSS.

View Chi-Square Hypothesis Test Results

Findings

From the observations, interviews and survey we identified five major stages of decision-making when symptoms of illness arise: 1) research symptoms, 2) evaluate information, 3) plan courses of action, 4) treat symptoms, and 5) assess treatment.

Five Stages of Decision-Making:

Participants expressed what support they needed during each of the five stages based on their priorities, knowledge, concerns, beliefs and experiences.

Stage #1: Research Symptoms

Internet

Eight out of ten participants in the observations used Google and WebMD as a research tool to learn about symptoms; two participants used MayoClinic. The remainder used either Skin Cancer Foundation or Zoc-Doc. Two participants admitted to skipping required fields in the symptom checker due to time constraints. Interview and survey results reflected similar findings about the internet as a research tool. Six out of eight participants in the interview used Google; three used WebMD, and the remainder used a mix of Mayo Clinic, MyChart and World Health Organization (WHO).

All 33 survey participants reported looking up symptoms online.

All Participants Looked up Symptoms Online - 100% (33 out of 33)

15 out of 33 participants reported using Google and WebMD. 10 reported using Mayo Clinic. 8 reported using Other Sites: National Institutes of Health (NIH), Baby Center, Centers for Disease Control (CDC) and a variety of articles on mental health, endocrinology and orthopedics.

Participants used Google and WebMD- 45% (15 out of 33)

Participants used Mayo Clinic- 30.3% (10 out of 33)

Participants used Other Sites (NIH, Baby Center, CDC, mental health, endocrinology, and orthopedics)- 24% (8 out of 33)

31 out of 33 participants reported looking up conditions online.

Participants Looked up Conditions Online - 94% (31 out of 33)

Other Resources

One participant in the interview mentioned looking up conditions in a medical book, since she reported not using the internet. Three out of ten participants in the observations used a mobile health app to check symptoms.

Stage #2: Evaluate Information

Trustworthiness of Online Health Information

Five out of seven participants in the interviews expressed low levels of trust in their sources; three wanted an easier way to distinguish legitimate health information.

Sometimes I’ll Google some of my conditions, and I will find actual research studies done by medical universities or medical research groups…I tend to trust those studies as far as I can really understand them.
- Kevin

If there was a way when you do a Google search, like a little lab coat that would appear next to the links, like a medical sign like the snakes on a stick…that we’re verified, I think that would make searching easier.
- Jill

During the observations, participants reported varying levels of trust in their online search results.

They [WebMD] just want me to sign up to sell me advertising. You never know what you’re going to click on or press that takes you to an advertisement, like I just did.
- Timothy

Participants in our survey reported higher levels of trust in online health information than those in our observations and interviews. Fourteen out of 33 expressed trust in the site they last used; five very much trusted.

Trust in the Last Site Used - 42% (14 out of 33)
Very Much Trust in the Last Site Used - 15% (5 out of 33)

Mayo Clinic

When comparing the most commonly used sites, eight reported Mayo Clinic it as trustworthy; 18 out of 33 reported it as very trustworthy.

Mayo Clinic is Trustworthy - 24% (8 out of 33)
Mayo Clinic is Very Trustworthy - 54.55% (18 out of 33)

WebMD

Eight reported WebMD as very trustworthy and ten reported it as trustworthy.

WebMD is Trustworthy - 30.3% (10 out of 33)
WebMD is Very Trustworthy - 24% (8 out of 33)

Google

Participants were nearly split in their assessment of Google with three reporting it as very trustworthy and seven as trustworthy; three labeled it not trustworthy and six labeled it somewhat not trustworthy. Twelve participants gave Google a neutral rating.

Google is Not Trustworthy - 9% (3 out of 33)
Google is Somewhat Not Trustworthy - 18% (6 out of 33)
Neutral Rating (Google is Neither Trustworthy or Untrustworthy) - 36% (12 out of 33)
Google is Trustworthy - 21% (7 out of 33)
Google is Very Trustworthy - 9% (3 out of 33)

Filtering Search Results

Participants in our observations and interviews reported feeling overwhelmed by both the quantity and content of search results when looking up online health information in the absence of provider guidance. Four out of ten participants in the observations found the results frightening due to the prevalence of the most lethal, but less common conditions listed first.

This is where you get into stuff where it’s scary(laughs). Everything, you know the first things that come up are: cancer, cancer, cancer.
- Valerie

Five out of seven interviewees stated they go to multiple sites to cross-check information.

I generally go to like 10 or 15 websites. I’ll see and compare information.
- Gina

It’s also just good to maybe look at 5 different websites. Let’s say you have a drug you want to know more about, well, um, I would tend to go to more than one website.
- Kevin

Four out of seven interviewees cited there were too many results to choose from. Some participants experimented between using keyword searches and full sentences to try to narrow down search results, as well as input specific conditions.

But if there was an oversight body that could rank them or give them some gold stars that could be somewhat helpful.
- Kevin

Satisfaction Levels when Researching Online Information

While our survey results did not specifically measure ways to filter search results, we did ask participants about their satisfaction level the last time they researched online information.

Fourteen out of 33 reported neutral satisfaction levels. 11 participants reported as Satisfied. 5 participants reported as Very Satisfied.

Neutral Satisfaction Level, when Last Researching Online Information - 42% (14 out of 33)

Satisfied, when Last Researching Online Information - 33% (11 out of 33)

Very Satisfied, when Last Researching Online Information - 15% (5 out of 33)

Stage #3: Plan Courses of Action

Seeking guidance

21 out of 33 survey participants cited the doctor’s opinion as the most common reason they decided to go to the doctor and ER; 13 reported family opinions helped them decide.

Doctor's Opinion was Most Common Reason Participants Saught Medical Help - 64% (21 out of 33)
Family Opinion Helped Partipants Decide to Seek Medical Help - 39% (13 out of 33)

14 reported they would use a peer forum to ask about symptoms that needed medical care; 19 reported they would not.

Peer Forum Used to Ask about Symptoms Requiring Medical Care - 42% (14 out of 33)
Would Not Use Peer Forum to Ask about Symptoms Requiring Medical Care - 58% (19 out of 33)

Twenty-six participants surveyed indicated that looking up symptoms online has sometimes made them more confident in their decision to go to the doctor or ER; three reported yes, very much.

Sometimes More Confident in Decision to Go to Doctor or ER, based on looking up symptoms online - 79% (26 out of 33)

Very Much Confident, based on looking up symptoms online - 9% (3 out of 33)

Observation and interview results reflected similar findings about how participants seeked guidance. All seven interviewees reported asking their doctor for advice about whether to go to the ER or schedule an office visit; five cited asking family; two mentioned asking friends.

Guidance as to whether this is an emergency or not. Whether I have to act upon something immediately or this is something to address in the near term, or it's not anything to be concerned about.
- Timothy

I think important things are sociability. It’s a good health thing. If you don’t ask your doctor, you can talk to friends, oh, have you ever had that pain here? You know you find out things through people, who are intelligent, who have had similar problems that you’ve had. So, sociability is very important.
- Arie

Communication with Medical Providers

Six out of 10 participants in the observations demonstrated how they communicated and shared health data with their doctors through messaging and attending virtual visits. Four used MyChart; two cited telehealth apps. One participant suggested transmitting photos.

It would be much easier if you had a tool where you had links up front, with all of your doctors, to their websites, and/or, allow you to privately communicate with any physician in your network, be able to send pictures and ask questions.
- Timothy

Two out of seven interviewees reported using MyChart to communicate with their doctors; one reported scheduling appointments through the hospital website; four cited calling their doctor directly for advice, scheduling appointments, or to request a medication refill authorization.

I think it’s important that internists follow up with phone calls after check-ups, better than sometimes they do. I know that sounds out-of-the-blue, but communication between doctors and patients I think can always be improved and I think… it’s important.
- Kevin

Stage #4: Treat Symptoms

Self-Treatment of Symptoms

Five out of ten participants in the observations reported self-treating mild to moderate symptoms with a mix of over-the-counter (OTC) medication, prescription drugs, and homeopathic remedies. Interview results reflected similar findings about self-treatment of symptoms. Five out of seven interviewees reported self-treating a variety of ailments such as allergies, constipation, colds and flu; all noted symptom severity influenced which ailments to self-treat and for how long.

From our survey results, we explored if age bracket identification was associated with symptom self-treatment preference; we found that the association was significant for the symptom of “cough”; χ ² (12, N = 33) = 21.288, p < .05 . Participants aged 25-35 were most likely to prefer self-treating for cough (n=14) than those in all the other age brackets: 18-24 (n=3), 36-45 (n=3), 46-54 (n=3) and 55-65 (n=7). Five out of fifteen in the 25-35 age group sometimes have self-treated for cough; nine have always self-treated for cough; one reported never having had the symptom of cough.

Survey Results: Symptoms Self-Treated

# Symptom No, I have always gone to the doctor or ER with this symptom # of Respondents Yes, sometimes I have self-treated for this symptom # of Respondents Yes, I have always self-treated for this symptom # of Respondents N/A – I have never had this symptom # of Respondents Total
1 Abdomen pain 12.50% 4 37.50% 12 28.13% 9 21.88% 7 32
2 Back pain 6.06% 2 51.52% 17 24.24% 8 18.18% 6 33
3 Suspected sprain 9.09% 3 39.39% 13 27.27% 9 24.24% 8 33
4 Cough 6.06% 2 45.45% 15 45.45% 15 3.03% 1 33
5 Tooth pain 42.42% 14 36.36% 12 9.09% 3 12.12% 4 33
6 Ear pain 18.18% 6 30.30% 10 12.12% 4 39.39% 13 33
7 Headache 6.06% 2 24.24% 8 60.61% 20 9.09% 3 33
8 Chest pain 12.50% 4 15.63% 5 12.50% 4 59.38% 19 33
9 Fever 6.06% 2 42.42% 14 45.45% 15 6.06% 2 33
10 Dizziness 15.15% 5 18.18% 6 21.21% 7 45.45% 15 33
11 Shortness of breath 12.12% 4 18.18% 6 6.06% 2 63.64% 21 33
12 Nausea 9.09% 3 21.21% 7 51.52% 17 18.18% 6 33
13 Gastrointestinal issues 9.09% 3 33.33% 11 36.36% 12 21.21% 7 33
14 Other 4.35% 1 13.04% 3 0.00% 0 82.61% 19 23

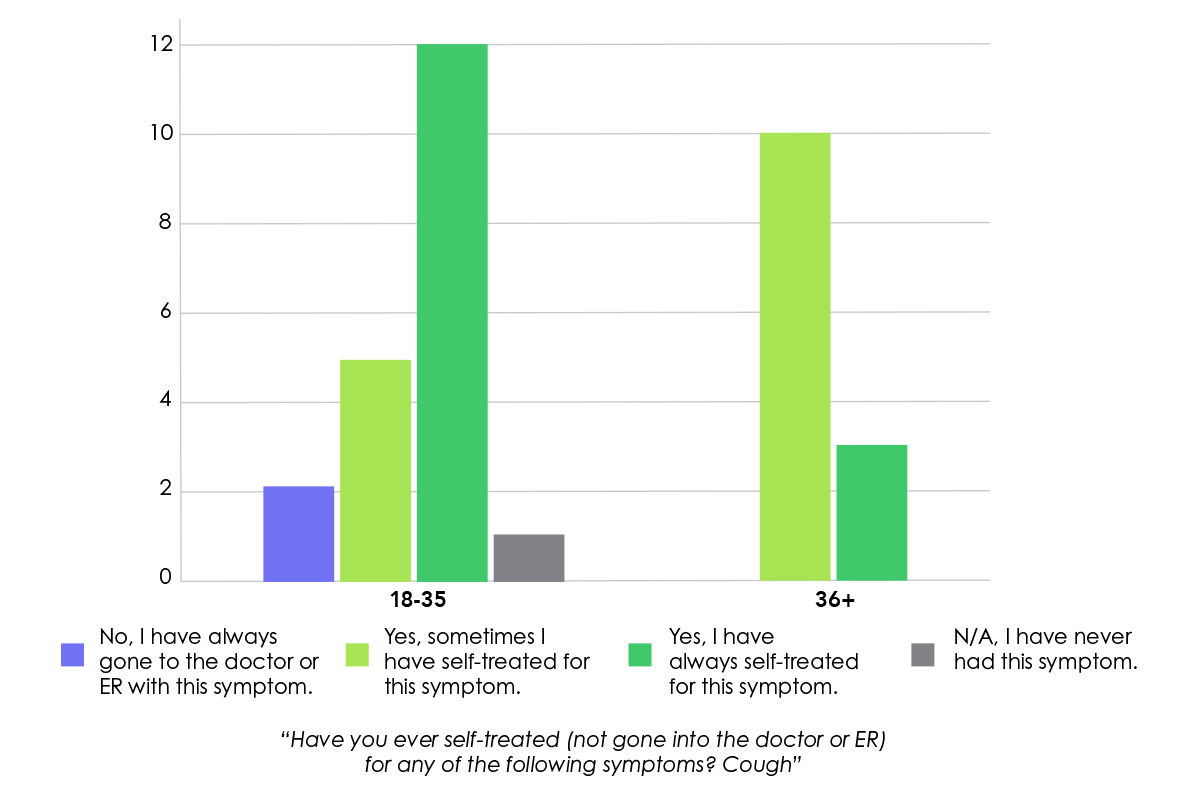
To further analyze how age influenced self-treatment of cough, we broadened our age groups and compared the 18-35 year olds with those 36+. We found that the association was significant for the symptom of “cough” χ² (3, N = 33) = 8.986, p < .05. Specifically, 18-35 year olds were more likely to identify with the “always self-treat” and those 36+ years old were more likely to identify with “sometimes self-treat.”

Prevalence of Self-Treatment of Cough Symptom for ages 18-35

We asked, “Have you ever self-treated (not gone into the doctor or ER) for any of the following symptoms? Cough”

  • In the 18-35 age group, 12 out of 33 responded, "Yes, I have Always Self-Treated for this Symptom" as opposed to 3 out of 33 respondents age 36+.
  • Image

    Highlight High Frequency Symptoms

    The technology, which we are calling, "MedAssist," would already know the age and personal health history of the user, and combined with artificial intelligence would make it easier for the user to select symptoms they experience and self-treat for frequently. The application can also monitor how successful self-treatments are for various conditions, track over time to learn if conditions are resolved, and make appropriate recommendations.

    Seek Medical Treatment

    Seeing a Doctor

    In our survey, 28 participants were seen by a doctor for a routine visit in the last year; five were not.

    Saw a Doctor for Routine Visit in Past 12 months - 85% (28 out of 33)
    Not Seen by Doctor for Routine Visit in Past 12 Months - 15% (5 out of 33)

    Seventeen participants reported seeing a doctor when feeling ill 1-2 times; four reported 3-4 times; one reported 5-6 times; eleven reported zero times.

    Saw a Doctor When Feeling Sick 1-2 Times - 51% (17 out of 33)
    Saw a Doctor When Feeling Sick 3-4 Times - 12% (4 out of 33)
    Saw a Doctor When Feeling Sick 5-6 Times - 3% (1 out of 33)
    Not Seen by Doctor When Feeling Sick - 33% (11 out of 33)

    Seventeen out of 33 survey participants considered themselves “healthy”; eight as “very healthy”; seven as neutral; one as unhealthy.

    Unhealthy - 3% (1 out of 33)
    Neutral Health Rating (Neither Healthy or Unhealthy) - 21% (7 out of 33)
    Healthy - 51% (17 out of 33)
    Very Healthy - 24% (8 out of 33)

    Two interviewees cited wait times for doctors as long. One interviewee cited she did not follow doctor recommendations for imaging.

    It'd be nice if you could check in and have your wait time. Like as soon as you walk in it's ready to go kind of thing. Kind of like the buzzers they have like at Cheesecake Factory.”
    - Katie

    So, they suggested I do an MRI, but I never went, I never scheduled an appointment for the MRI. So I still don’t, I haven’t like, there’s been no resolution for that. But that’s kind of on my end because I never followed up with the MRI appointment.
    - Janelle

    Visiting Walk-In Clinics

    Twenty-four out of 33 participants surveyed reported visiting walk-in clinics in the last year. Seven participants cited long wait times; ten reported positive experiences citing it was good for simple things and cost-effective for the uninsured and convenient for college students. Three out of seven interviewees indicated they had been to the walk-in clinic for a mix of symptoms such as bruises, abdominal pain, tongue sores and a shingles vaccine.

    Visited a Walk-In Clinic in the Last 12 Months - 73% (24 out of 33)

    On their website [walk-in clinic] actually have a list and they let you know if it's something that they could probably help you with. Um, so like one time I was experiencing abdominal pain and they actually recommend that you go straight to the ER.
    - Katie

    Visiting the Emergency Room (ER)

    Twenty-four out of 33 participants surveyed reported visiting the ER; four cited expense and cost as the most common reason for not considering going to the ER. Seven participants surveyed reported they had a negative experience; three said they could have died; six mentioned long wait times; five were scared or nervous; two were admitted to the hospital.

    Visited the Emergency Room - 73% (24 out of 33)

    My experience with the hospital I go to is that it might help to have the doctor aware that you’re going to ER here in the city of Chicago that sometimes smoothes the way for an easier entrance into the ER because it’s very, very crowded.
    - Kevin

    Stage #5: Assess Treatment

    Treatment Decisions

    Despite long wait times and other issues, most participants surveyed reported they made the right decision when going to the doctor or ER. When we asked, “Have you ever made a wrong decision to go to the doctor or ER for yourself or someone else, over 80% (n=27) reported “No”; six reported “Yes.” Interviews reflected similar results as all five participants that went to the ER reported that the visit was necessary. One observation participant, Timothy, reported that two of his ER visits were unnecessary.

    Made the Right Decision to Go to Emergency Room - 81% (27 out of 33)
    Made the Wrong Decision to Go to Emergency Room - 18% (6 out of 33)

    I was accompanying my husband for an emergency; felt fortunate that his doctor had called ahead and wait time was minimal.
    - Survey Respondent

    Horrible. Waited forever. Doctor wasn't even great. Info given in the ER not transcribed on chart correctly. Could have died because of this.
    - Survey Respondent

    3. Define

    Methods for this phase

    Method 4: Features Ranking

    Based on the data obtained in the observations, interviews, and survey phase, we devised relevant features within our matrix according to priority, impact, and feasbility for the two user types (personas).

    Feature Priority Matrix

    Feature Description Priority Impact Feasibility User Type (Persona)
    Highest-to-Lowest Ranked Features for Both Personas
    Symptom Diary Keeps track of current and past symptoms including their severity, frequency and duration High High High Both
    Virtual Visit A secure, real-time video visit with a healthcare provider High High High Both
    Image Sharing Users can upload photos of their own physical symptoms so that the doctor can examine them to provide a better diagnosis High High High Both
    Message Center A place where patients can ask questions or request a callback or visit asynchronously High High High Both
    Alerts for Emergency Situations Provides a warning to users about symptoms that indicate a potentially life-threatening emergency. Alerts user about the best action to take (e.g. ER or Ambulance) High High High Both
    Chat Feature A way to interact with a medical professional in real-time via text chat High High High Both
    Health Data Sharing Allows instant transmission and two-way communication between patient and provider using an On-Demand Provider link to enable customized advice both in real-time and asynchronously High High High Both
    Peer Forum An online community of laypeople sharing information/experiences about symptoms and/or conditions. Sometimes they are currently experiencing the symptoms. Other times they have experienced them in the past High High High Both
    Thumbprint Sign-In Eliminates the need to remember a password High Medium Medium Both
    Thermometer Uses cell phone temperature sensor to check body temperature Medium High Medium Both
    Voice-User Interface Minimizes time and energy exerted to get desired information Medium Medium High Both
    Health and Wellness Additional information suitable for consumption outside of the self-triage process. Includes general health information, preventive care, nutrition Low Medium High Both
    Virtual Stethoscope Plugs into a smartphone or tablet to monitor heart and lung sounds during a virtual visit Low Medium Low Both
    Highest-to-Lowest Ranked Features for "Busy Brianna" Persona
    Assisted Self-Triage A recommendation of what course of action to take after a condition has been narrowed down High High High Brianna
    Intelligent Symptom Educator A quiz taken by the user that utilizes conditional logic in order to provide the most likely possible conditions based on the symptoms entered and pre-populated personal health history High High High Brianna
    Conditions Ranked by Likelihood A visual representation of the order ranking of most likely conditions High High High Brianna
    Guidance Navigator Recommends courses of action for when to seek guidance from providers or how to perform self-care High High High Brianna
    Verification Badges for Sources A visual representation of a source’s credentials (e.g. research study) High High High Brianna
    Reminder to Take Action If a user reports having a symptom that would be serious if it were to persist for one week or more, the user would receive an alert at the one week mark to take action High High High Brianna
    Images Photos of certain physical symptoms for user comparison High High High Brianna
    Symptom Icon Buttons Avoids the need to type in symptoms Medium High High Brianna
    Highest-to-Lowest Ranked Features for "Sandeep the Seeker" Persona
    Verification Badges for Doctors A visual representation of a source or doctor’s credentials (e.g. board certified) High High High Sandeep
    After Visit Follow-Up Patients can view their doctor’s summary and notes for a recap of their visit High High Medium Sandeep
    Lab Results Patients have access to their current and past lab results. Includes completion status indicator and abnormal status indicator High High Medium Sandeep
    Personal and Family Health History Medical Records, PCP and Insurance provider saved to user’s profile and pre populated into fields throughout the portal as needed High High Medium Sandeep
    Request Prescription Refills Within the medication list a user can request a refill from their doctor or pharmacy High High Medium Sandeep
    Facility Wait Times Predicts the wait time to be seen at a walk-in clinic or ER High High Low Sandeep
    Find Nearest Facility Map and list of healthcare providers/facilities by distance, type, and insurance. Includes contact information, estimated wait times, GPS directions and ETA High Medium High Sandeep
    Medication List A list of currently prescribed medications including side effects, drug interactions and dosing instructions. This list is automatically updated when a new medication is prescribed Medium High Medium Sandeep

    Method 5: Scenarios + Journey Maps

    After we identified relevant features based on user needs, we created scenarios based on user personas to demonstrate how these features will benefit and meet the users’ needs specified.

    Brianna's Scenario

    Brianna is a 23-year-old graduate student and has a new job as a Project Manager. She recently moved to Chicago, Illinois.

    Brianna noticed she has developed a cough and does not want to go to the doctor right away. She wants to treat her symptoms herself as she is enrolled in her company’s insurance plan and does not have any paid time off yet. In the past, she has “Googled” her symptoms and has gotten a massive list of possible illnesses such as lung cancer, which freaked her out. A friend at work told her about a new MedAssist app, which is one of the company’s benefits.

    Over the weekend, Brianna downloads the app onto her phone. After adding her personal information, the MedAssist app pre-populated with Brianna’s health insurance HMO plan, primary care doctor, and medical records. Brianna wants to use the Intelligent Symptom Checker to see what she should do about her cough, which she has had for about a week. Brianna selects the symptom icon from the top of the screen. She is prompted by a series of questions written by a doctor that shows he is affiliated with Cleveland Clinic. MedAssist returns the three most likely options for her issue. She touches a button to see the three options.

    Option 3 seems to most closely match what she is feeling. MedAssist also has a built-in thermometer feature that takes your temperature by holding the phone over your forehead or under the armpit. Brianna takes her temperature, which is 99-degrees. MedAssist reports back that if the temperature rises over 100.5, and if the cough persists for more than two weeks, she should contact a doctor.

    After two weeks have passed, Brianna still has a cough with phlegm, and now has a sinus issue. MedAssist alerts her to contact a medical provider. When Brianna adds the new symptom of sinus congestion, she sees it populate above her older symptoms of cough and 99-degree fever from two weeks earlier. After another week goes by, Brianna goes into the MedAssist OnDemand Provider Message Center and requests a virtual visit. She sends the MedAssist Symptom Diary, which has the list of the symptoms and their duration. Brianna begins her virtual visit using the MedAssist app that allows her to breathe into the phone, which is connected to the medical provider’s virtual stethoscope. Since her symptoms have not gotten better, the provider recommends an antibiotic for five days. MedAssist knows the nearest pharmacy location and alerts Brianna when the prescription is ready. Brianna begins to take the antibiotic and starts to feel relief after the third day. Brianna is glad to have MedAssist be her guide to managing her symptoms and helping her get well.

    Brianna's Journey Map to Wellness

    Brianna's journey to treat her cough

    Brianna's Journey Map

    Sandeep's Scenario

    Sandeep is a 48-year-old engineer in Austin, Texas. Recently, he had his yearly physical and wants to find out his lab results. It is usually difficult for him to check his results. He first has to remember multiple passwords for different hospital logins. One hospital uses MyChart, and the other uses a proprietary system. On those occasions where he could not log in, he would look up the doctor’s phone number. The answering machine system for the practice of eight doctors would say, “Listen to this message in its entirety since options have recently changed.”

    Luckily, Sandeep recently downloaded the MedAssist mobile app on his smartphone to help him manage his health. At the top of the screen, he can access his doctors and check health data. From the dropdown list, he selects Lab Results and sees the order from Dr. Rothman with the green indicator that the results are ready. He picks the results and sees a list of all the different tests he had. They all look good except for his cholesterol, which is marked with a high alert indicator. Since Sandeep and his doctor didn’t discuss cholesterol during his appointment, he messages his doctor by selecting, “have a question about your lab results?” which takes him directly to the OnDemand Provider Message Center with the name of his doctor chosen already. Sandeep selects the option to receive a call back from his doctor. Since he just had a visit in-person, he skips the option to request a virtual appointment. Sandeep hopes Dr. Rothman gets back to him quickly, as before using MedAssist, it often took two days to get a response.

    That evening, the doctor calls Sandeep back. He mentions he would like to start Sandeep on medicine that should lower his cholesterol and discusses the benefits and side effects. He calls in a prescription for the medication. Sandeep, who is also managing another chronic condition, was happy to hear back from his doctor so quickly. Sandeep wants to learn more about the medicine. Once the doctor added the medication to his health records, MedAssist automatically updated it with a new medication list. Sandeep checks the MedAssist app by clicking the Medications button and selects the medicine to learn about dosing instructions, drug interactions, and side effects. Sandeep is glad to know about these before starting his prescription, so he knows not to take it with citrus in the morning. Sandeep also checks MedAssist for other ways that he can lower his cholesterol, and foods to avoid. Sandeep is happy to have all the information he needs in one place.

    Sandeep's Journey Map to Wellness

    Sandeep's journey to treat his cholesterol

    Sandeep's Journey Map

    Discussion

    In this project, we aimed to understand the decision-making process of how people resolve health issues and concerns when symptoms of illness arise. We conducted observations with ten participants. Following our observations, we conducted seven interviews. We gained insight into user goals, motivations, activities and pain points. We then conducted a survey and collected data from thirty-three respondents. Survey results supported our previous findings, with some differences noted.

    After completing our research and analysis, we identified five stages users go through when responding to a health issue: 1) research symptoms; 2) evaluate information; 3) plan courses of action; 4) treat symptoms; 5) assess treatment. We explored how these themes helped inform implications for design.

    (1) Research Symptoms Stage

    When using online symptom checkers, participants often skipped over required fields due to time constraints, such as inputting their medications and, for females, if they were pregnant. This implied that our solution must be fast, easy-to-use, and assist the user by populating data based on stored personal health history, saving users’ time when inputting responses to scaffolded questions.

    (2) Evaluate Information Stage

    Participants voiced major concerns with credibility and trustworthiness of online health information when seeking knowledge about their symptoms and conditions. This implied that our solution must include content authored and overseen by an accredited body of qualified board-certified doctors, teaching hospitals, and research institutions that have no conflicts of financial interest with sponsors.

    Participants felt the quality and quantity of search results to make informed decisions about their symptoms was often overwhelming, frightening, and ambiguous due to the need to decipher and sort through complex medical terminology. This implied that our solution must perform the filtering and sorting of results for the user and rank them according to symptom severity and personal health history. Results must be easy-to-understand with common conditions listed first.

    (3) Plan Courses of Action Stage

    When determining courses of action, participants cited they needed guidance about their symptoms to know the type of care they needed and who should provide it. Some users sought advice from friends, family, and online forums. This implied that our solution must provide recommendations for when to seek guidance from providers, perform self-care, give wait times of local emergency rooms, and have access to moderated peer forums.

    Participants cited responsive and timely communication as a primary concern when sharing health information, requesting medication refills, obtaining lab results, and seeking advice from medical providers. This implied that our solution must provide health data sharing that facilitates two-way communication between patients and providers across health networks.

    (4) Treat Symptoms Stage

    Younger participants cited more frequent self-treatment of their symptoms, and often put off doctor appointments and recommended tests; participants aged 36+ sought regular visits with their doctors seeking follow-up and additional knowledge about their conditions. This implied that our solution must provide reminders and alerts to ensure symptoms get resolved and to highlight frequently self-treated symptoms.

    (5) Assess Treatment Stage

    Participants cited that how their health issue was triaged can impact the timeliness and quality of care received. Participants reported when doctors give advance notice to ERs, patients access treatment faster and easier. This implied that our design must assist patients in the triage process by alerting ERs that a patient is coming and sending their health data to avoid errors in the intake process.

    When visiting local walk-in clinics, participants were sometimes turned away if their particular health issue could not be treated there, resulting in treatment delays and increased health risks. This implied that our design must educate users on which symptoms can be treated at these facilities.

    Limitations of Work

    Our observations and interviews had small sample sizes consisting of ten participants in the observation phase and seven in the interview phase. Most participants were female consisting of six females in each of the observations and interviews; twenty-two out of thirty-three survey participants were female. Most participants were young and healthy with a majority between the ages of 18-35 living in the greater metro Chicago, Illinois area. Additionally, scenario-based observations were a limited way to explore this problem.

    After analyzing survey results, we were unable to test our original hypotheses because we did not have two comparable groups. In the future, we would create a new survey to address demographic gaps such as health insurance plan type and income. We would then explore how age, income and type of insurance coverage are related to self-treatment. Our symptom list was limited, and we could refine it by adding or removing symptoms. We also would consider incorporating additional inquiry methods such as diary studies for participants to track the course of their symptoms. We also would perform a more in-depth research review of consumer and professional symptom checkers and self-triage tools, as we only focused on those found on free websites.

    Top